

Order Book and Reading Charts
The order book shows current supply and demand, while the chart shows price history. Reading both is a fundamental trading skill.
Order Book
The order book, or Depth of Market, lists all active limit buy orders (bids) and sell orders (asks). Asks appear above the current price, and bids appear below it.
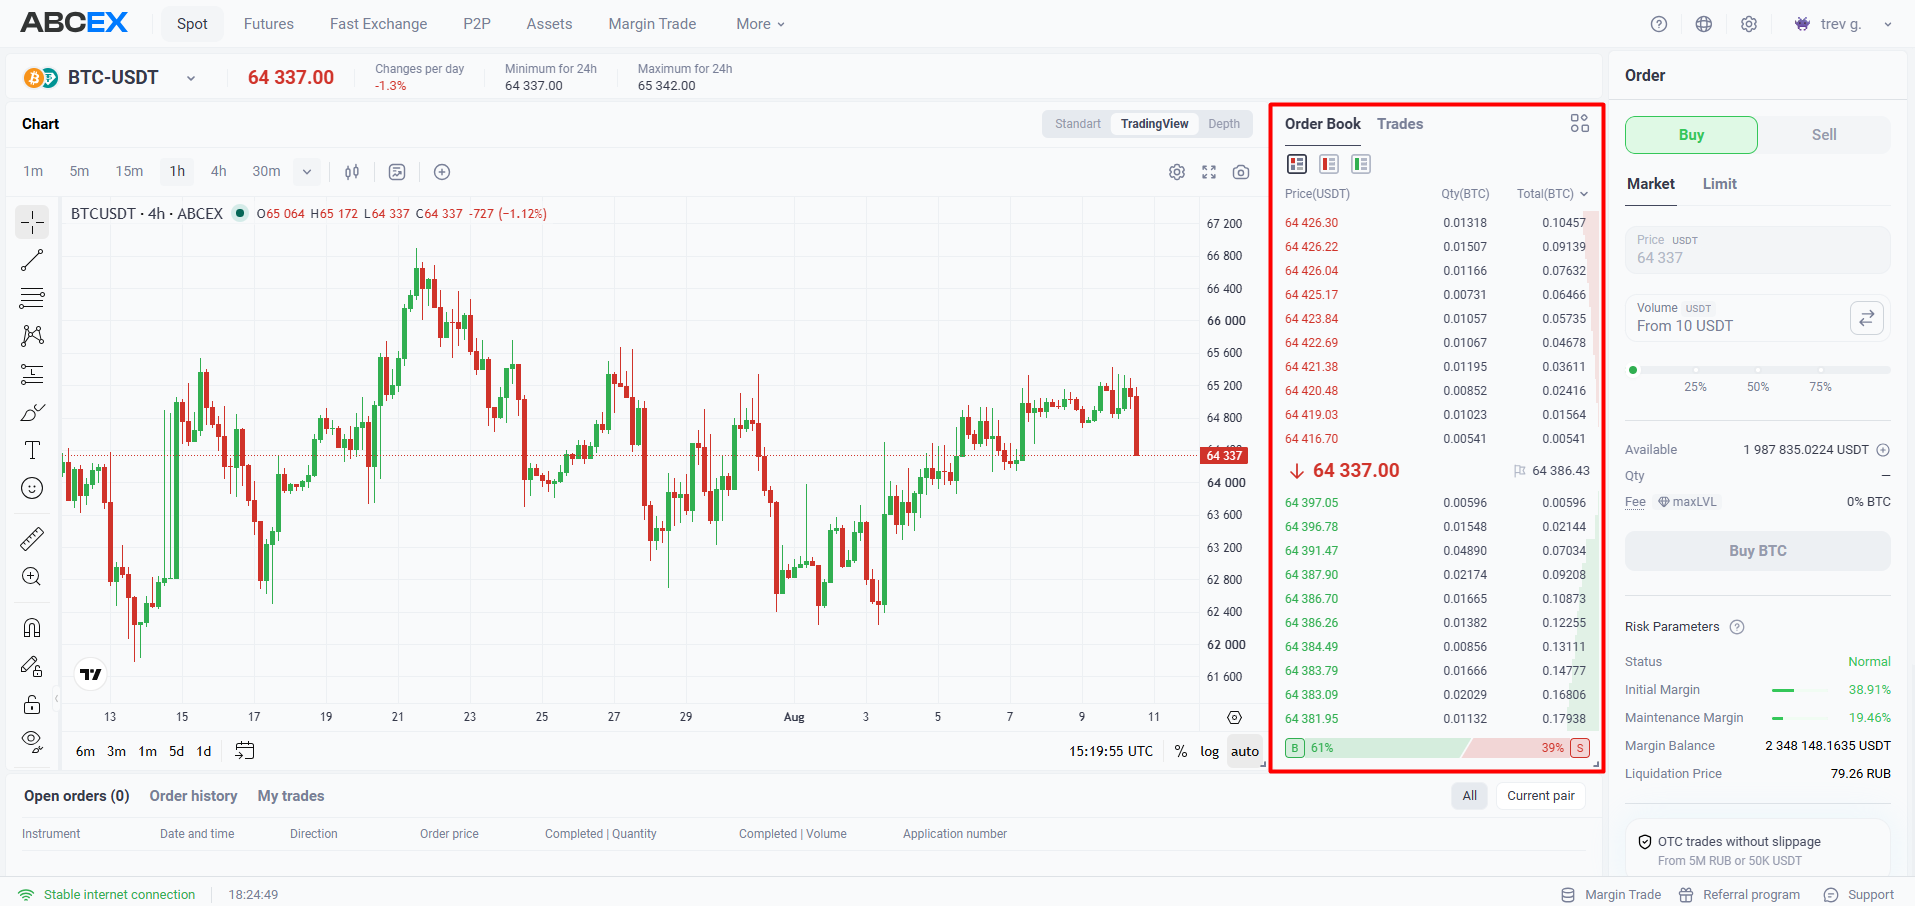
- Asks (red) - sellers - Limit sell orders. The best ask is the minimum price at which someone is willing to sell right now.
- Bids (green) - buyers - Limit buy orders. The best bid is the maximum price at which someone is willing to buy right now.
- Spread — The difference between the best ask and the best bid. The smaller the spread, the higher the liquidity of the pair and the fewer losses during market execution.
What the Order Book Shows
| Situation | What it may indicate |
|---|---|
| Large volume on the ask side (many sellers) | Strong resistance — the price may turn downward |
| Large volume on the bid side (many buyers) | Strong support — the price may bounce upward |
| Low depth on both sides | Low liquidity: a large order can move the price significantly |
| A large order appears and disappears quickly | Possible manipulation, such as spoofing |
Price chart and candles
ABCEX uses a candlestick chart. Each candle represents one time period, such as 1 minute, 5 minutes, 1 hour, or 1 day.
- Bullish candle — The close is higher than the open, so the price rose during the period.
- Bearish candle — The close is lower than the open, so the price fell during the period.
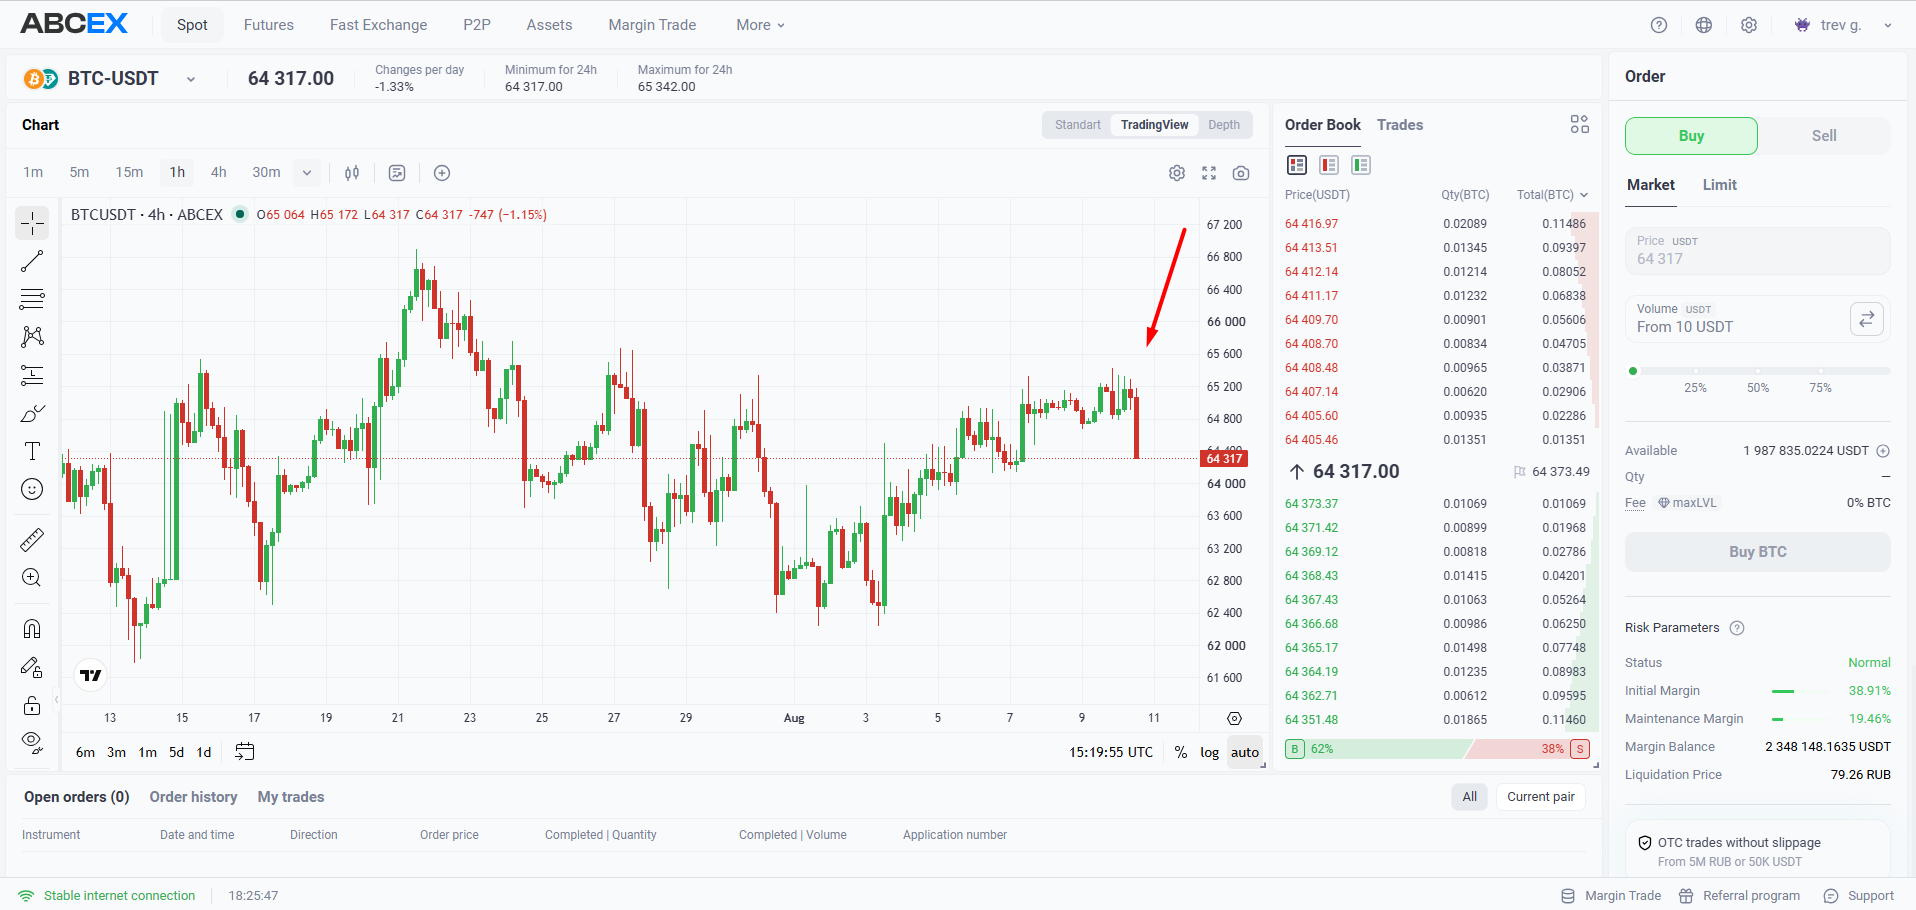
What a candlestick consists of (4-hour BTC-USDT)
Opening price65,064 USDT
Maximum (high)65,172 USDT
Minimum (low)64,317 USDT
Closing price64,317 USDT
Candle typeBearish (−1.15%)
What timeframe to start with
Use the daily (1D) and four-hour (4H) charts to understand the broader trend, then the hourly (1H) or 15-minute chart to look for an entry. Trading from a 1-minute chart without experience carries a high risk of loss.
On this page